Bottom-Up Market Sizing for Startup Founders

Bottom-up market sizing estimates your addressable revenue by counting real, reachable customers and multiplying by a realistic revenue per customer (ARPU). That single calculation, done rigorously, is what separates a number investors trust from one they dismiss in the first five minutes of a pitch.
Before you build a slide or open a spreadsheet, confirm you have five things:
- Defined segments with explicit criteria (industry, company size, geography, job title)
- A primary source for every customer count (Census, BLS, SUSB, LinkedIn, or a trade registry)
- An ARPU figure derived from pilot data, competitor pricing, or a willingness-to-pay survey
- Reach and penetration assumptions tied to your actual sales capacity and channel
- Sensitivity bounds showing low, base, and high outcomes across your two biggest variables
Investors have seen thousands of pitches built on a percentage of a large market. A defensible bottom-up number built from customer counts and real pricing is far more persuasive than any top-down TAM claim.
Table of Contents
- What is bottom-up market sizing?
- Bottom-up vs top-down: which approach do you actually need?
- How to build a bottom-up model you can defend
- Where to find U.S. customer counts: datasets and counting techniques
- How to determine ARPU for your model
- How to validate your model and stress-test the numbers
- Worked example: B2B SaaS targeting mid-market HR teams
- Spreadsheet structure and tools that speed the build
- How to present market sizing on a pitch slide
- Key Takeaways
- The mistake most founders make with market sizing
- Launchbrief builds your investor-ready market-sizing brief in 30 minutes
- Authoritative U.S. data sources for your market-sizing model
What is bottom-up market sizing?
Bottom-up market sizing is a revenue estimation method that starts with the smallest countable unit, usually a customer or a transaction, and builds upward. You count the customers you can realistically reach, multiply by what each one pays, and sum across segments. The result is a market estimate grounded in your own business model rather than in an analyst's broad industry definition.
The contrast with top-down analysis is straightforward. Top-down starts with a published market figure (say, a Statista or IBISWorld total) and applies a percentage to claim a slice. It is fast and useful for quick scoping, but it tells an investor almost nothing about whether your business can actually capture revenue. Visible.vc's framework recommends building TAM/SAM/SOM from customer counts times ARPU and then validating against competitor revenue and observable signals. That is the standard early-stage investors now expect.
For pre-revenue and seed-stage startups, bottom-up is the preferred method because every assumption is testable. You can show a pilot customer, a signed LOI, or a pricing experiment. You cannot defend "we only need 0.1% of a $50 billion market" with anything concrete.
Bottom-up vs top-down: which approach do you actually need?
Both methods have a place. The mistake is using them interchangeably.
| Dimension | Bottom-Up | Top-Down |
|---|---|---|
| Starting point | Your customer unit and price | Published industry revenue total |
| Data requirement | Primary sources: Census, BLS, LinkedIn, pilots | Secondary sources: analyst reports, Statista |
| Investor reception | High credibility; assumptions are auditable | Low credibility alone; useful as a sanity check |
| Best use case | Investor pitches, go-to-market planning, unit economics | Quick scoping, board summaries, large established markets |
| Risk | Undercount if segments are too narrow | Overcount; "1% of a huge market" fallacy |
| Time to build | Several hours to days | Minutes to an hour |
Top-down adds genuine value when you need to communicate scale quickly to a non-technical audience or when you are sizing a large, well-documented market where analyst data is reliable. It also helps you set a ceiling: if your bottom-up total exceeds the top-down figure, something is wrong with your assumptions.
The right approach for most investor conversations is to run both and triangulate. If your bottom-up SAM is $400 million and a credible industry report puts the total market at $2 billion, that gap is worth explaining. If your bottom-up number is $3 billion and the industry report says $800 million, you have a counting error somewhere. Large gaps between the two methods are a signal to audit your inputs before an investor does it for you.
How to build a bottom-up model you can defend
The framework has five steps. Each one produces a specific output that feeds the next, and each requires documented sources.
Step 1: Define your segments
Split your addressable market into groups that share a buying profile: same industry, company size, geography, and decision-maker role. A B2B SaaS product might have three segments: small businesses (1–49 employees), mid-market (50–499), and enterprise (500+). A consumer app might segment by age cohort and metro area.
The output of this step is a segment table with explicit criteria. If you cannot write down exactly who qualifies, you cannot count them.
Step 2: Count reachable customers per segment
For each segment, find the number of potential buyers using primary sources. The U.S. Census Bureau's Statistics of U.S. Businesses (SUSB) gives establishment counts by NAICS code and employment-size band. BLS occupational data gives role-level counts by industry. LinkedIn Sales Navigator gives filtered company and contact counts. Document the source, the query or filter used, and the retrieval date for every number.
Step 3: Determine ARPU per segment
ARPU is the annual revenue you expect from one customer. For a subscription product, it is the annual contract value. For a transaction product, it is average transaction value times expected frequency. Break it into components: recurring subscription, one-time setup fee, transaction fees, and expansion or upsell revenue. Use pilot data when you have it. Use competitor pricing pages and SEC filings when you do not.
Step 4: Apply reach and penetration assumptions
Not every countable customer is reachable. Your sales team, marketing budget, and channel partnerships limit how many you can actually pursue. Apply a realistic penetration rate to convert your theoretical count into a serviceable obtainable market (SOM). Document the rationale: "We can close 2 deals per sales rep per month; with 3 reps in Year 1, that is 72 customers maximum."

Step 5: Aggregate and run scenarios
Multiply customers by ARPU for each segment, sum across segments, and apply your penetration rate. Then run three scenarios: low (conservative ARPU, lower penetration), base (your best estimate), and high (favorable ARPU, higher penetration). The range tells investors you understand the uncertainty in your model.
Pro Tip: Keep a dedicated "Assumptions" tab in your spreadsheet. Every input cell should link to a source log entry with the URL, the specific data point pulled, and the date retrieved. An investor who asks "where does this number come from?" should be able to follow the trail in under 30 seconds.
Where to find U.S. customer counts: datasets and counting techniques
The quality of your bottom-up model depends almost entirely on how you count customers. Here are the primary U.S. sources and how to use each one.
-
U.S. Census SUSB (census.gov/programs-surveys/susb): Filter by NAICS code and employment-size band to get establishment counts. If you sell to mid-market manufacturers, pull NAICS 31–33 with 50–499 employees. This is the most defensible source for B2B customer counts.
-
data.census.gov: Use population tables for consumer-facing segments. Pull a city-level count, then scale to national using the city's share of total U.S. population. This is the standard technique for regional-to-national extrapolation.
-
BLS Occupational Employment Statistics: Count addressable users by job title. If your product serves HR managers, BLS gives you the national count of HR managers by industry. Also useful as a demand signal: a job title growing at 8% annually suggests an expanding addressable pool.
-
SEC/EDGAR — Pull 10-K filings from public competitors to cross-check customer counts and revenue per customer. If a competitor reports 4,000 enterprise customers and $200 million in revenue, their implied ARPU is $50,000. That is a useful benchmark for your own ARPU assumption.
Triangulating multiple sources is standard practice. LinkedIn alone commonly over- or under-counts relative to Census data. Use two or three sources and note where they converge.
Pro Tip: When scaling from a city sample to a national estimate, use the Census population ratio rather than a round multiplier. If your pilot city has 1.2% of the U.S. population, multiply your city count by 83, not by "roughly 100." That precision signals to investors that you did the work.
How to determine ARPU for your model
ARPU is where most early-stage models fall apart. Founders either copy a competitor's list price without adjusting for discounts, or they use a number that feels aspirational rather than defensible. There are three legitimate approaches.
| ARPU Method | When to Use | Defensibility |
|---|---|---|
| Historical customer data | Post-revenue startups with 10+ customers | Highest — real transactions |
| Competitor pricing analysis | Pre-revenue; public pricing pages or SEC filings available | Medium — requires discount adjustment |
| Willingness-to-pay survey or pilot | Pre-revenue; direct customer access | High if sample is 20+ respondents |
Conservative, base, and aggressive ARPU
Always document three ARPU assumptions. Conservative uses the lowest observed price in your competitive set, adjusted downward for early-customer discounts. Base uses your pilot data or a midpoint of competitor pricing. Aggressive uses your target price after product maturity. The spread between conservative and aggressive should be explainable in one sentence.
How to validate your model and stress-test the numbers
A bottom-up model that has never been challenged is not investor-ready. Validation means running it against external signals until you are confident the number survives scrutiny.
Triangulation against competitor revenue
The most powerful cross-check is competitor revenue. If a public competitor reports $150 million in annual revenue and serves roughly 3,000 enterprise customers, their implied ARPU is $50,000. If your model assumes $80,000 ARPU for the same customer profile, you need a clear explanation. Pull competitor data from SEC/EDGAR 10-K filings or from Statista market benchmarks to anchor your triangulation.
Sensitivity analysis on your two biggest variables
Run a two-variable sensitivity table on customer count and ARPU. These are almost always the two inputs with the most uncertainty and the most impact on the final number.
| ARPU: — | ARPU: $18,000 | ARPU: $24,000 | |
|---|---|---|---|
| 500 customers | $6M | — | $12M |
| — | $12M | $18M | $24M |
| 2,000 customers | $24M | — | $48M |
This table takes five minutes to build and answers the question every investor will ask: "What happens if you're wrong?" Show it in your appendix, not buried in a spreadsheet tab.
Common mistakes and how to fix them
- Stale data — A Census dataset from three years ago may not reflect current market conditions. Note the vintage of every source in your log and flag inputs older than two years.
Pro Tip: Before your pitch, ask a skeptical colleague to attack your two largest assumptions. If you cannot defend them in 90 seconds with a source, go back and strengthen the evidence. Investors will find the weak point; better you find it first.
Worked example: B2B SaaS targeting mid-market HR teams
This example walks through a realistic bottom-up model for a hypothetical HR workflow SaaS product targeting U.S. companies with 50–499 employees.
Step-by-step calculation
-
Pull segment count from SUSB — Using the U.S. Census SUSB, filter for all industries with 50–499 employees. For this example, the filtered count should be taken directly from the current dataset to ensure accuracy. (In practice, you would pull the exact NAICS-filtered figure and paste the URL into your source log.)
-
Apply an industry filter — Your product is specifically relevant to companies with a dedicated HR function. Based on BLS employment data, HR managers are concentrated in industries like professional services, healthcare, and finance. Narrowing to those NAICS codes reduces the addressable pool to a smaller subset defined by exact data from those sources.
Sensitivity table
Provide sensitivity ranges based on conservative, base, and aggressive ARPU alongside low, base, and high customer count estimates. This range illustrates the uncertainty in your forecast. EasyVC's step-based approach recommends anchoring your base case to the most conservative defensible inputs, then letting the upside case speak for itself.
Cross-check: if a comparable public HR SaaS company serves 2,000 mid-market customers at a similar price point, your 460-customer Year 3 target is roughly 23% of their current base. That is a plausible share for a well-funded early-stage competitor, not an implausible land-grab.
Spreadsheet structure and tools that speed the build
A clean spreadsheet is part of the deliverable. Investors who want to dig in will open the file. If it is disorganized, that signals the same thing about your thinking.
Suggested tab structure
- Source Log — URL, data point pulled, retrieval date for every external input
Recommended tools and how to use each
- U.S. Census Bureau data tools — (data.census.gov, SUSB): Pull establishment and population counts; export to CSV and paste into Segment Counts tab with source URL.
- BLS Occupational Employment and Wage Statistics — Download role-level employment tables; use to count addressable job titles and flag growth trends.
- SEC/EDGAR full-text search — Pull competitor 10-K filings; search for "customers," "ARR," or "average contract value" to extract ARPU benchmarks.
- Statista — Use for top-down market revenue benchmarks to triangulate your bottom-up total.
Ideoreto's collaborative framework recommends assigning each data-collection task to a specific team member with a deadline, treating the model build like a sprint. That discipline prevents the common failure mode where the model sits half-finished because no one owns the sourcing work.
Version your spreadsheet with a date in the filename (e.g., market-sizing-2026-03-15.xlsx) and keep prior versions. When you update inputs after a pilot or a new data pull, the version history shows investors that the model is a living document, not a one-time guess.
How to present market sizing on a pitch slide
The slide itself should be sparse. One number is not enough; a wall of numbers loses the room. The target is a single, scannable slide that answers three questions: how big, how you know, and what you can realistically capture.
Appendix checklist
Keep these ready for the follow-up data room or due diligence request:
- Sources tab from your spreadsheet (exported as PDF)
- Sample customer list or LOI summary (even 3–5 named prospects signals real pipeline)
- Competitor revenue cross-check (one table showing competitor customer count × ARPU vs. your model)
- Methodology note (two paragraphs explaining your counting approach and ARPU derivation)
Pro Tip: Prepare to defend your two largest assumptions in 60–90 seconds each. The question will come. Know exactly which source you used for the customer count, why you chose that ARPU, and what experiment you would run in the next 90 days to validate both. Investors are not just evaluating the number; they are evaluating whether you think rigorously under pressure.
Visible.vc's guidance is direct on this point: a number without an audit trail is rarely persuasive. The appendix is what converts a skeptical investor into a convinced one.
Key Takeaways
Bottom-up market sizing is only as credible as the sources behind each input: document every customer count, ARPU figure, and penetration assumption with a primary source before you present to investors.
| Point | Details |
|---|---|
| Count real customers first | Use SUSB, BLS, and LinkedIn to count reachable customers before applying any revenue assumption. |
| Build ARPU from components | Break annual revenue per customer into recurring, one-time, and expansion components; anchor to pilot data or competitor filings. |
| Show TAM, SAM, and SOM | Present all three figures with explicit timeframes; cap SOM by your actual sales capacity, not market share ambition. |
| Run a sensitivity table | Test your two highest-impact variables (customer count and ARPU) across low, base, and high scenarios before any investor meeting. |
| Launchbrief accelerates the build | Launchbrief delivers a structured GTM brief with cited sources, a market-sizing model, and an investor-ready appendix in 15–30 minutes. |
The mistake most founders make with market sizing
The number founders get wrong most often is not the TAM. It is the SOM, and specifically the penetration assumption buried inside it.
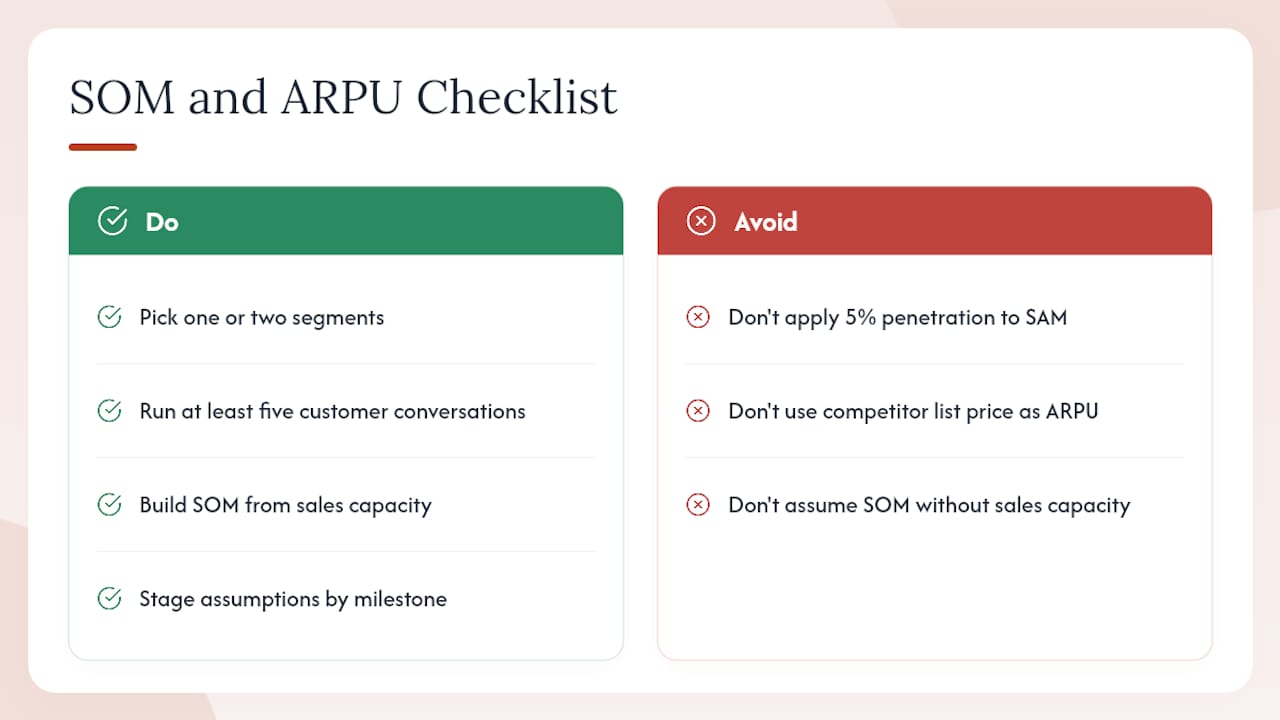
Here is the pattern: a founder builds a careful bottom-up customer count using Census and BLS data, derives a reasonable ARPU from a competitor's pricing page, and then applies a 5% penetration rate to the SAM because "that feels conservative." The problem is that 5% of a $400 million SAM is $20 million, and the founder has two salespeople. The math does not work. Investors see it immediately.
The fix is to build SOM from the bottom up too, not just TAM and SAM. Start with your actual sales capacity: how many deals can your team close per month, at what average contract value, with what expected churn? That gives you a Year 1 and Year 3 SOM that is grounded in operational reality rather than a percentage of a large number.
The second recurring mistake is ARPU without evidence. Founders often use a competitor's enterprise list price when their actual early customers are SMBs who will negotiate a 30–40% discount. The result is an ARPU assumption that looks reasonable on paper but collapses the moment an investor asks about your pilot pricing. Run at least five customer conversations with a specific price point before you commit to an ARPU in your model. A signed LOI or even a verbal commitment at a stated price is worth more than any benchmark.
The pragmatic playbook: pick one or two segments, get pilot ARPU evidence from real conversations, build your SOM from sales capacity rather than market share, and stage your assumptions by milestone. "We assume $19,200 ARPU based on three signed pilots; we will validate at $24,000 by Q3 when we close our first enterprise deal." That sentence is more persuasive than any spreadsheet formula.
Launchbrief builds your investor-ready market-sizing brief in 30 minutes
Pulling Census data, filtering SUSB tables, cross-checking competitor 10-Ks, and assembling a sensitivity model typically takes a founder two to three days. Launchbrief compresses that into a structured GTM research brief delivered in 15–30 minutes, with every claim anchored to a live source link.

The brief covers market sizing (TAM, SAM, SOM with bottom-up methodology), competitor analysis with revenue cross-checks, channel strategy, pricing and unit economics, and a risk assessment. Every section includes the source URL so you can paste it directly into your spreadsheet's source log and cite it in your investor appendix. You can see the format and depth in sample reports like the Personio brief, which shows how sources, segment counts, and investor-ready summaries are structured.
Launchbrief is built for founders who need a defensible document fast, not a generic AI summary. Order a brief at launchbrief.io and receive a structured, source-traced market-sizing model you can walk into your next investor meeting.
Authoritative U.S. data sources for your market-sizing model
| Source | What to Pull | How to Cite in Source Log |
|---|---|---|
| U.S. Census SUSB | Establishment counts by NAICS code and employment-size band | Paste the filtered table URL, NAICS code used, size band, and retrieval date |
| data.census.gov | Population by geography for consumer-segment scaling | Paste the table URL, geographic filter, and year of data |
| BLS Occupational Employment Statistics | Role-level employment counts and industry growth trends | Paste the OES table URL, occupation code, and retrieval date |
| SEC/EDGAR | Competitor customer counts and revenue per customer from 10-K filings | Paste the filing URL, company name, fiscal year, and the specific line item cited |
| Statista | Top-down market revenue benchmarks for triangulation | Paste the report URL, market definition, and year of data |
| SBA Office of Advocacy | Small business counts and industry breakdowns | Paste the report URL and publication date |
| Trade associations (SHRM, NAM, etc.) | Industry-specific membership counts and spend surveys | Paste the report URL, association name, and publication date |
Short reading list for methodology support
- Visible.vc on bottom-up sizing: The clearest explanation of the TAM/SAM/SOM build from customer counts and ARPU; cite this in your methodology note.
- Oscom.ai on sourcing techniques: Practical guidance on LinkedIn, BuiltWith, and job-posting signals; useful for your source log rationale.
- Ideoreto on collaborative model-building: Good for team workflows and ARPU-by-segment logic.
- EasyVC on step-by-step forecasts: Covers scenario analysis and validation techniques in a founder-friendly format.
This article provides general educational information about market-sizing methods and is not a substitute for professional financial or investment advice. Verify all data inputs against current primary sources before presenting figures to investors.