How to Calculate LTV for Startup Founders

The fastest version: LTV = ARPU × Gross Margin % × (1 ÷ Monthly Churn Rate). For transactional businesses, use LTV = AOV × Purchase Frequency × Average Lifespan × Gross Margin %. The decision rule that follows is simple: target a strong LTV:CAC ratio and keep CAC payback under a year if you're selling to SMBs.
- SaaS example: ARPU $500/month, gross margin 75%, monthly churn 2% → LTV = $500 × 0.75 × (1 ÷ churn rate) = LTV calculated accordingly
- Transactional example: AOV $120, 4 purchases/year, 3-year lifespan, 50% margin → LTV estimated by multiplying these factors
- Payback rule: For SMB SaaS (ACV under $20k), target payback under 12 months and LTV:CAC of roughly 3:1 in gross-margin terms.
These formulas assume stable churn. When NRR exceeds 100% or you have heavy expansion revenue, the math changes — covered below.
Table of Contents
- Which LTV formula should you actually use?
- How to calculate LTV step by step
- Why cohort and channel LTV beats a blended average
- What "true gross margin" actually means for LTV
- Worked examples with copyable spreadsheet formulas
- How to turn LTV into concrete decisions
- Common LTV mistakes that distort your unit economics
- What to track and how to report LTV operationally
- Key Takeaways
- The number founders get wrong most often
- Get your LTV and unit economics in 30 minutes
- Useful sources
Which LTV formula should you actually use?
Customer lifetime value (LTV), also called CLV, is the expected gross profit a customer generates over the entire relationship. Not revenue. Gross profit. That distinction materially changes your allowable CAC spend and every downstream budget decision.

Revenue LTV vs. gross-margin LTV: Revenue LTV overstates economic value. If your gross margin is 60%, a $30,000 revenue LTV is really an $18,000 profit LTV. Most B2B SaaS companies operate at 75–85% gross margins, so the gap is smaller but still real. For physical products or marketplace businesses with 30–50% margins, using revenue LTV can double your perceived acquisition budget.
Churn-based lifetime (1 ÷ monthly churn) works cleanly when churn is stable. It breaks when NRR exceeds 100%, because the denominator goes negative or near-zero, producing absurd LTV figures. In that case, apply a finite-expansion heuristic or cap the horizon at 36–60 months, which is what most investors expect anyway.
| Business model | Recommended LTV approach | Time horizon |
|---|---|---|
| SaaS subscription | ARPU × Gross Margin × (1 ÷ Monthly Churn) | 36–60 months cap |
| Transactional / e-commerce | AOV × Frequency × Lifespan × Margin | 12–36 months |
| Marketplace | Net take rate × Lifetime GMV × Margin | 24–48 months |
| Freemium | Paid conversion rate × Paid ARPU × Margin × Lifetime | 24–36 months |
For freemium models, calculate LTV only on converted paying users. Blending free and paid users into one figure produces a number that's neither useful nor defensible.
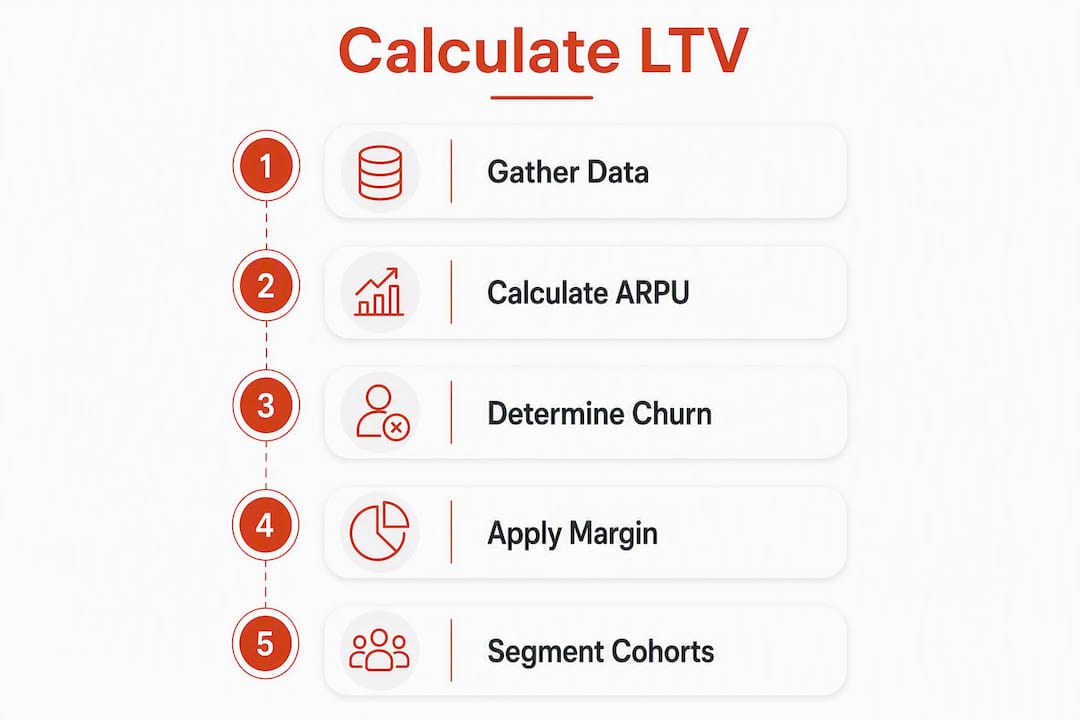
How to calculate LTV step by step
This workflow produces a cohort-based LTV you can defend to investors or used to set next quarter's CAC budget.
- Define your unit and cohort. Decide whether you're measuring per account or per user. Group by signup month and acquisition channel. A cohort is only useful if it's homogeneous enough to behave similarly.
- Compute ARPU or ARPA. Divide MRR by active accounts for monthly ARPU. For annual billing, use ACV divided by 12 to get a monthly equivalent.
- Calculate true gross margin per account. Pull hosting, customer success salaries, onboarding costs, third-party API fees, and payment processing. Accounting gross profit often misses these. More on this in the next section.
- Build a retention curve. Plot the percentage of each cohort still active at months 1, 3, 6, 12, 18, and 24. When churn is volatile, use the survival table directly rather than the 1 ÷ churn shortcut. Early activation milestones like completing onboarding or hitting a first-value moment are strong predictors of long-term retention.
- Apply the margin-adjusted formula. Multiply cohort ARPU by true gross margin by estimated lifetime. When NRR exceeds 100%, cap the horizon at 36–60 months rather than letting expansion revenue run to infinity.
Google Sheets snippets (assuming row 2 has your inputs):
- ARPU:
=B2/C2(MRR in B2, active accounts in C2) - Monthly churn:
=D2/E2(churned accounts in D2, starting accounts in E2) - LTV:
=B2/C2 * F2 * (1/G2)(F2 = gross margin %, G2 = monthly churn rate)
Pro Tip: Don't calculate LTV from fewer than 50 accounts or less than 6 months of data. Small samples produce wildly unstable churn rates, and a single large churned account can swing your LTV estimate by 40% or more.
Why cohort and channel LTV beats a blended average
A single blended LTV is one of the most misleading numbers a startup can produce. Tracking LTV by acquisition channel reveals that paid social, organic search, and referral customers often have dramatically different retention behaviors, even at identical ARPU.
Here's a concrete pattern: paid acquisition cohorts frequently churn faster in months 1–3, while referral and organic cohorts show stronger retention curves past month 6. A blended average hides that gap and leads you to overspend on paid channels. Always calculate LTV by cohort and acquisition channel rather than relying on a single blended average, since blended figures can misallocate your CAC and mask high-value segments.
Practical grouping patterns:
- Acquisition channel (paid search, organic, referral, outbound)
- Plan or segment (SMB vs. mid-market, monthly vs. annual)
- Onboarding cohort date (to catch product changes)
- Contract term (monthly vs. annual billing)
Sample-size and observation minimums:
- Minimum 50 accounts per cohort before drawing conclusions
- Minimum 6 months of observation for subscription businesses; 12–24 months for transactional
- Flag cohorts with high variance (standard deviation above 30% of mean LTV) as unreliable
Operational steps to produce channel LTV comparisons:
- Tag every new account with its acquisition source at signup.
- Pull monthly revenue and churn by cohort in your data warehouse or a Google Sheet.
- Calculate ARPU, churn rate, and gross margin separately per cohort.
- Compute LTV per cohort and rank channels by LTV:CAC.
- Reallocate CAC budget toward channels where LTV:CAC exceeds 3:1 and payback is under 12 months.
What "true gross margin" actually means for LTV
Accounting gross profit is a starting point, not the answer. Most SaaS income statements exclude costs that are genuinely per-customer, which means your LTV is higher on paper than in reality.
Direct costs to deduct from revenue before calculating LTV:
- Hosting and infrastructure costs allocated per account
- Customer success and support salaries (prorated by accounts served)
- Onboarding and implementation expenses
- Third-party API fees charged per usage or per account
- Payment processing fees (typically 2–3% of revenue)
- Fulfillment and shipping costs for physical products
Common accounting mistakes:
- Using the P&L gross margin line, which often excludes customer success headcount
- Treating onboarding as a one-time sunk cost rather than amortizing it across expected lifetime
- Ignoring shared infrastructure costs that scale with customer count
Pro Tip: Spread one-time onboarding costs across the expected cohort lifetime. If onboarding costs $800 per account and average lifetime is 24 months, add $33/month to your per-account COGS before computing gross margin.
Worked examples with copyable spreadsheet formulas
SaaS example
| Input | Value |
|---|---|
| ARPU (monthly) | $500 |
| Gross margin | 75% |
| Monthly churn | 2% |
| CAC | $3,000 |
Calculations:
- LTV = $500 × 0.75 × (1 ÷ 0.02) = $18,750
- LTV:CAC = $18,750 ÷ $3,000 = 6.25:1
- Payback = $3,000 ÷ ($500 × 0.75) = 8 months
Google Sheets: =A2*B2*(1/C2) for LTV; =D2/(A2*B2) for payback in months.
Horizon cap: If NRR is 105%, don't let that formula run forever. Cap at 48 months: =MIN(A2*B2*(1/C2), A2*B2*48).
Transactional example
| Input | Value |
|---|---|
| AOV | $120 |
| Purchase frequency (annual) | 4 |
| Average lifespan (years) | 3 |
| Gross margin | 50% |
- LTV = $120 × 4 × 3 × 0.50 = $720
- Google Sheets:
=A2*B2*C2*D2
For transactional businesses, use historical cohort data across a 12–24 month window to estimate purchase frequency and lifespan. Don't force a churn model onto repeat-purchase behavior.
How to turn LTV into concrete decisions
LTV is only useful when it drives a specific action. Here are the rules that matter most at the early stage.
CAC budget rules:
- 3:1 LTV:CAC is the floor. Below that, you're likely burning cash on acquisition faster than you're recovering it.
- Above 5:1, you're probably underinvesting in growth. Raise CAC targets or expand channels.
- For bootstrapped or capital-constrained startups, a 6-month payback beats a theoretically higher LTV collected over 36 months. Cash in hand funds the next cohort.
Payback thresholds by segment:
- SMB SaaS (ACV under $20k): target payback under 12 months
- Mid-market (ACV $20k–$100k): 12–18 months is acceptable
- Enterprise: 18–24 months can work if NRR is strong
When to pull which lever:
- Churn is above 3% monthly → fix onboarding and activation before raising CAC budgets. A 1-point churn reduction at $500 ARPU and 75% margin adds roughly $9,375 to LTV.
- Gross margin is below 60% → audit COGS before scaling acquisition. Every dollar of margin improvement multiplies directly into LTV.
- LTV:CAC is above 5:1 → increase acquisition spend or test new channels. You're leaving growth on the table.
- Payback exceeds 18 months for SMB → either raise prices or cut CAC. Don't wait for LTV to "catch up."
Common LTV mistakes that distort your unit economics
Most LTV errors fall into a few predictable patterns.
- Blended averages: A single company-wide LTV hides which channels and segments are actually profitable. Always segment by cohort.
- Revenue instead of gross margin: Using top-line revenue inflates LTV and leads to overspending on CAC. Gross-margin LTV is the only defensible version.
- Logo churn vs. revenue churn: If you lose small accounts but retain large ones, logo churn overstates the problem. Revenue churn is the correct input for LTV.
- Small-sample volatility: An LTV from 15 accounts is noise. Wait for 50+ before acting on the number.
- Survivorship bias: Cohorts with long observation windows only contain customers who stayed. Early churners are gone from the data, making retention look better than it was.
- Ignoring refunds and discounts: Net revenue after refunds, discounts, and credits is the correct ARPU input.
- Treating NRR above 100% as infinite LTV: Cap the horizon at 36–60 months. Investors will.
On predictive models: Machine learning LTV predictions are useful when you have thousands of accounts and rich behavioral data. For most early-stage startups, a clean cohort table beats a black-box model. Use ML when your cohort analysis is already solid and you need to predict LTV at the individual account level for sales prioritization.
What to track and how to report LTV operationally
Core dashboard metrics:
- Cohort ARPU/ARPA by channel and plan
- Monthly revenue churn rate (not logo churn)
- True gross margin per account
- Net Revenue Retention (NRR)
- LTV by cohort and acquisition channel
- CAC by channel
- CAC payback period
- LTV:CAC ratio
Reporting template (monthly snapshot):
| Metric | Month 1 | Month 2 | Month 3 |
|---|---|---|---|
| Cohort ARPU | $500 | $500 | $500 |
| Monthly revenue churn | 2% | 2% | 2% |
| True gross margin | 75% | 75% | 75% |
| LTV (margin-adjusted) | $18,750 | — | $18,750 |
| CAC (blended) | $3,000 | $3,000 | $3,000 |
| LTV:CAC | 6.25 | 6.25 | 6.25 |
| Payback (months) | 8 | 8 | 8 |
Cadence and ownership: Review LTV metrics monthly at the operational level. The founder or head of finance owns the calculation methodology; the growth or revenue lead owns channel-level LTV:CAC. Run a quarterly audit of COGS inputs to catch margin drift before it compounds.
Key Takeaways
Margin-adjusted, cohort-segmented LTV is the only version worth building acquisition budgets around — revenue LTV and blended averages both produce numbers that mislead more than they inform.
| Point | Details |
|---|---|
| Use gross-margin LTV | Deduct hosting, support, API, and processing costs before computing LTV — revenue LTV overstates your real acquisition budget. |
| Segment by cohort and channel | Blended LTV hides high-churn paid channels; calculate separately per acquisition source and plan. |
| Prioritize payback at the early stage | For SMB SaaS, target CAC payback under 12 months and LTV:CAC of roughly 3:1 in gross-margin terms. |
| Cap NRR-expansion models | When NRR exceeds 100%, cap LTV at 36–60 months to keep projections defensible for investors. |
| Use Launchbrief for faster unit economics | Launchbrief delivers GTM research briefs with sourced LTV and unit-economics analysis in 15–30 minutes. |
The number founders get wrong most often
LTV is treated as a proof point when it should be a diagnostic. Founders present a high LTV to investors as evidence of a healthy business, when the real question is: what is driving that number, and is it durable?
A high LTV built on a single large customer, a cohort too young to show real churn, or revenue figures that haven't been adjusted for gross margin is not a signal of product-market fit. It's a deferred reckoning. The founders who use LTV well are the ones who treat a low number as a clue — usually pointing to onboarding gaps, pricing misalignment, or a channel that attracts the wrong customer profile.
The other thing most guides skip: payback period is often more important than LTV at the early stage. A $50,000 LTV collected over 7 years is less useful to a seed-stage company than a $12,000 LTV collected in 14 months. Cash timing matters. LTV:CAC ratios look great on a slide; payback period tells you whether you can survive long enough to collect it.
Build the cohort table first. Let the LTV number emerge from real retention data, not from a formula applied to a blended average. That's the version worth defending.
Get your LTV and unit economics in 30 minutes
Calculating LTV accurately takes clean data, the right cost inputs, and a methodology investors won't pick apart. Launchbrief delivers a structured GTM research brief that includes defensible unit-economics analysis — LTV by cohort, CAC payback, gross-margin adjustments, and channel strategy — sourced with live web links and delivered in 15–30 minutes.

No spreadsheet archaeology. No waiting a week for a consultant. You get a decision-ready document you can put in front of co-founders or investors the same day. See a live example of how Launchbrief structures unit economics in a real GTM brief, then order yours at launchbrief.io.
Useful sources
- Unit Economics Explained: LTV, CAC, and Why They Make or Break Your Startup — PitchGrade: clear breakdown of LTV:CAC benchmarks and gross-margin framing for founders.
- Customer Lifetime Value (CLV/LTV): Definition, Formula & Examples — Churnbase: covers the standard SaaS LTV formula and why gross margin is the correct input.
- How to Calculate Customer Lifetime Value for B2B SaaS — Human Renaissance: detailed guide on true gross margin, NRR-expansion caps, and transactional LTV modeling.
- Unit Economics — Basedash: practical framing of CAC payback vs. LTV for early-stage and bootstrapped startups.
- How to Calculate Unit Economics for a Startup — Startupik: explains cohort and channel segmentation for LTV and CAC optimization.
- How to Calculate Lifetime Value of a Customer in B2B SaaS — EngageKit: covers activation milestones and predictive LTV signals for subscription businesses.
- LTV Formula Guide by Business Model — Ficilcom: model-specific LTV formulas for subscription, e-commerce, and B2B.
- LaunchBrief GTM Research Brief — example report: shows how Launchbrief structures unit-economics and LTV analysis in a delivered brief.